🚀 Daffathan-Labs
When the System is Running… But I Can't See It
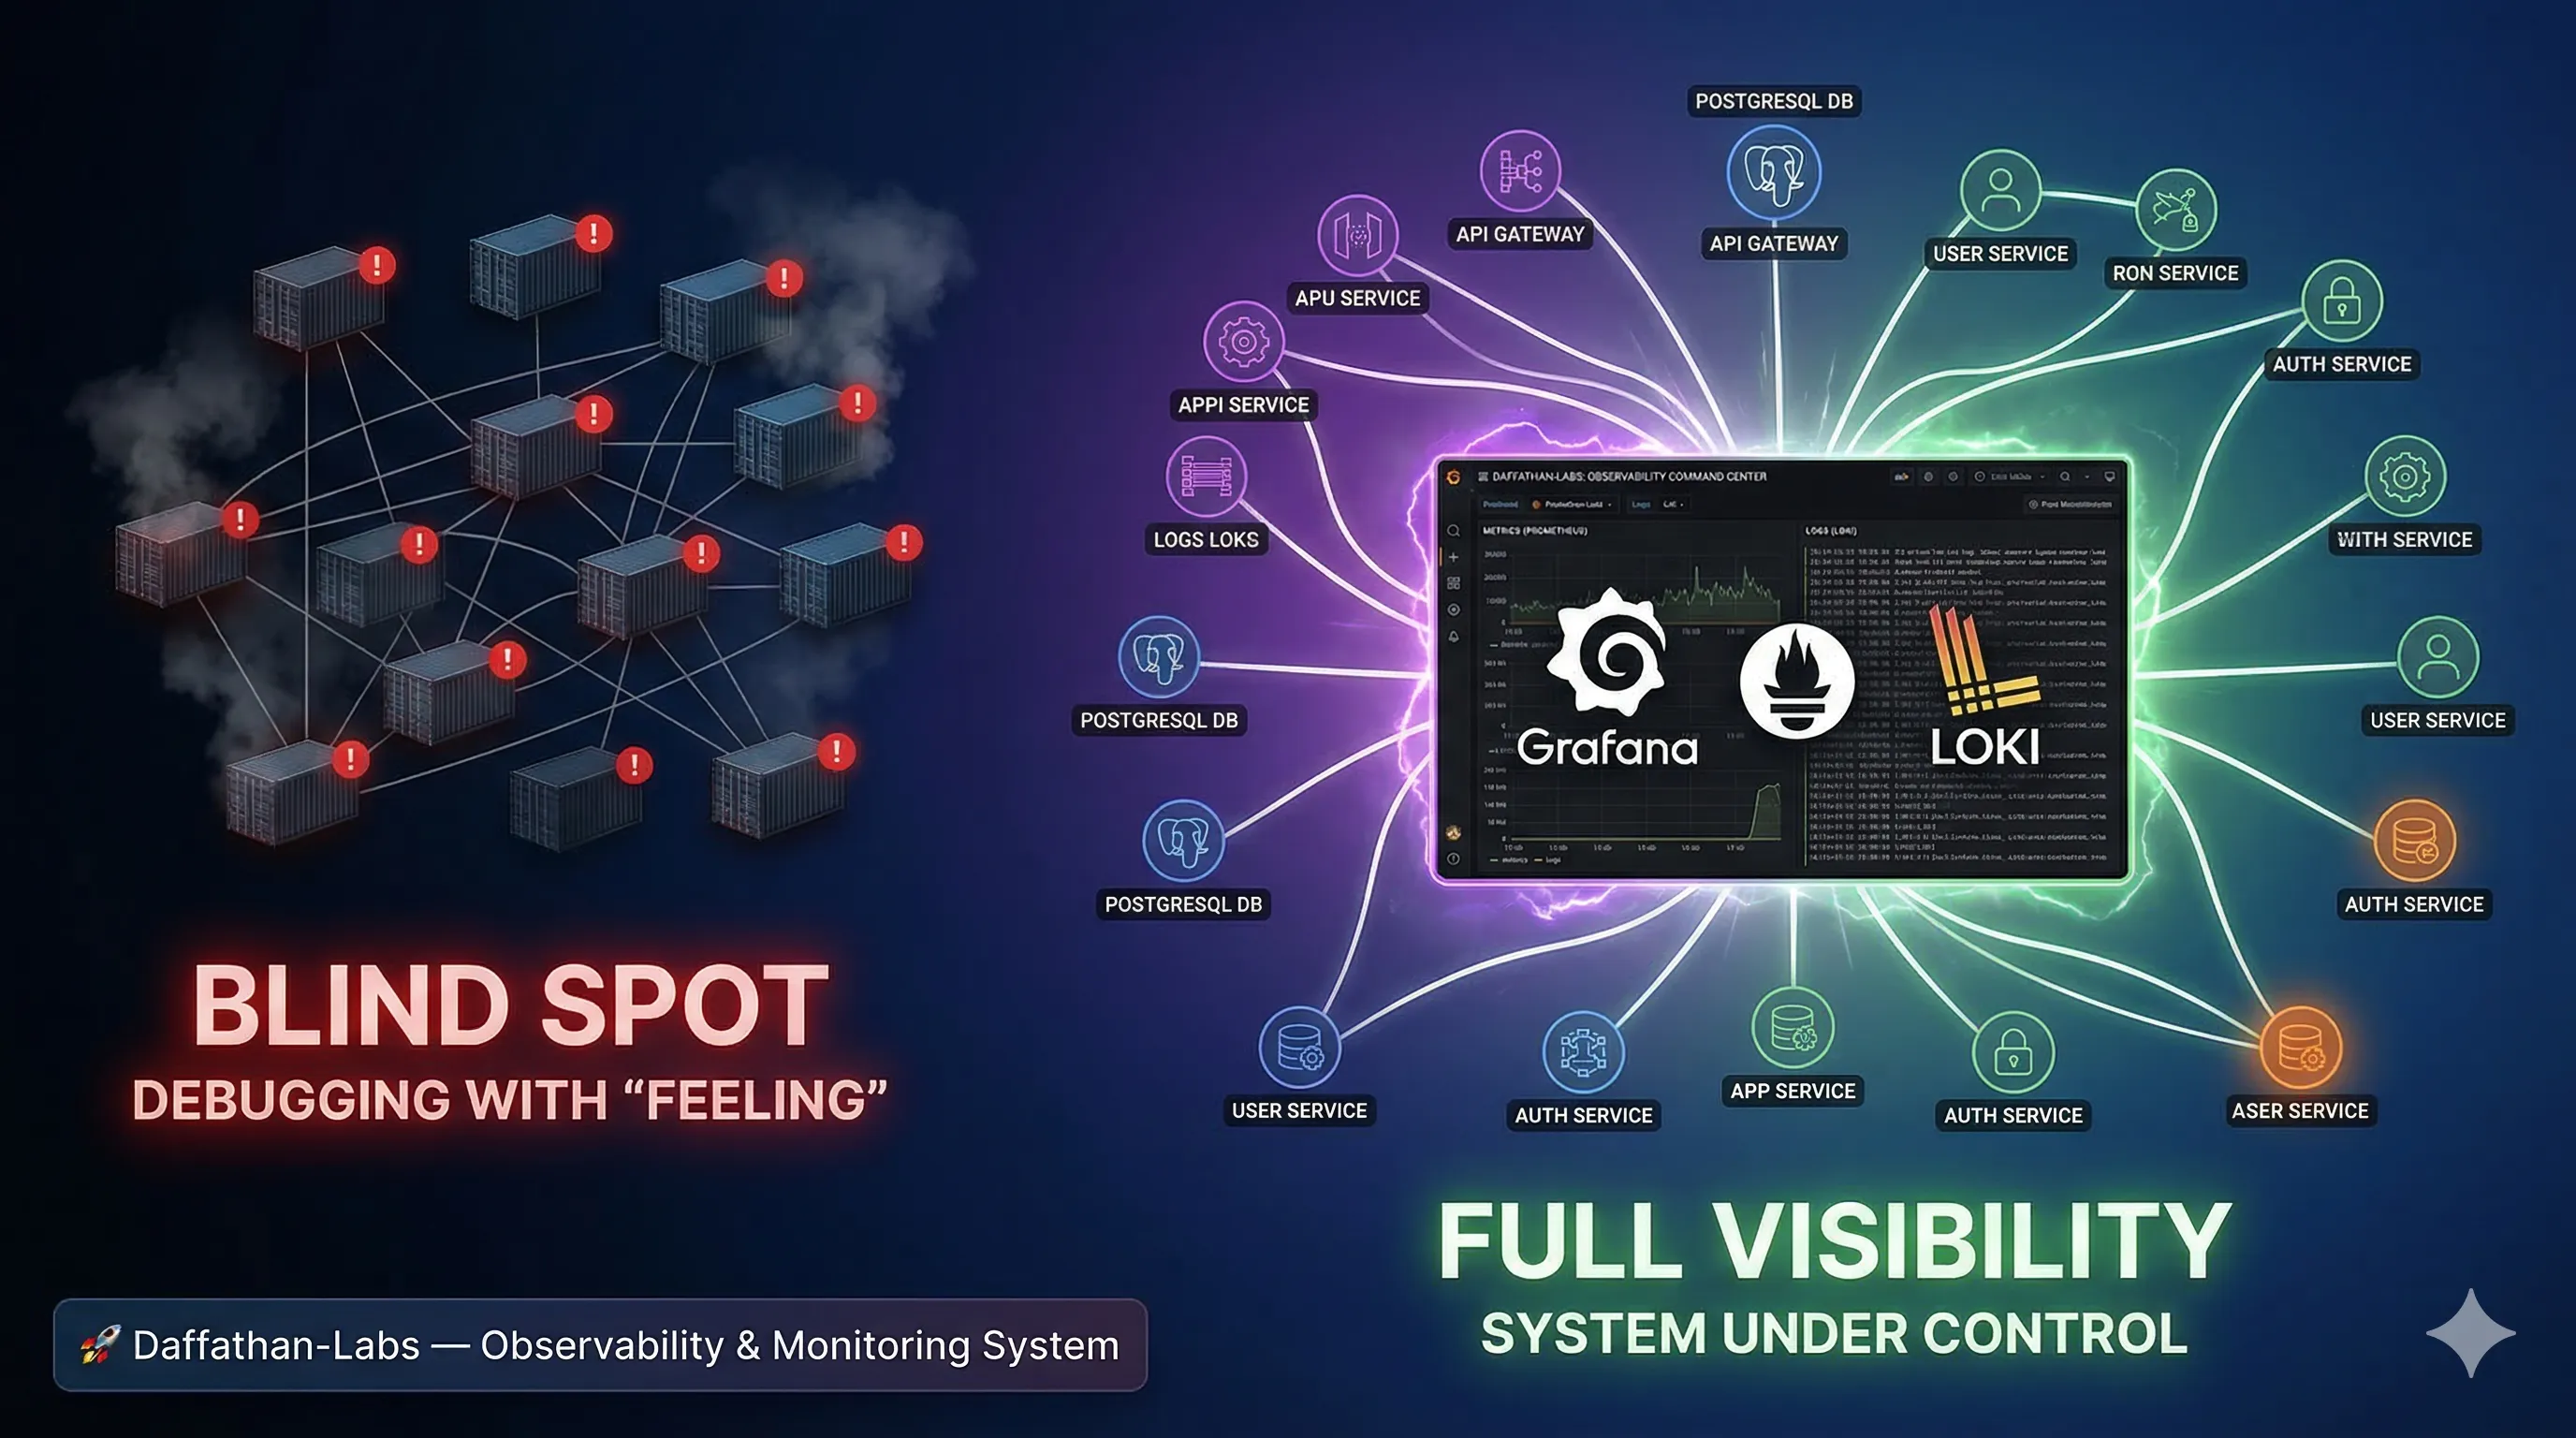
Initially, I thought everything was enough.
-
CI/CD was automated.
-
Deployment was zero-downtime.
-
All services were running.
But there was one big problem that emerged quietly.
I didn't really know what was happening inside my own system.
🧠 The Awakening Point
One day, I asked myself:
"If the API suddenly errors… where do I check?"
"If the server suddenly slows down… who's at fault?"
"If the database gets stuck… who's the culprit?"
And the honest answer was…
👉 I didn't know.
😵 The Reality I Faced
Back then, whenever there was a problem, my workflow was like this:
docker logs <container>
Then repeat… again… and again… for other containers.
I had to open logs one by one.
Manual scrolling.
Search for errors by "feeling".
👉 Honestly, this is tiring and not scalable.
Besides that, there were other more serious problems:
-
❌ I didn't know who was consuming the most RAM
-
❌ I didn't know why PostgreSQL was sometimes slow
-
❌ I didn't have one place to see everything
Everything was scattered.
Everything was separate.
Everything was frustrating.
🔥 At That Point, I Realized
You can't fix something you can't see.
And from there, the observability journey at Daffathan-Labs began.
🛠 What I Built
I didn't want to debug by "feeling" anymore.
So I built these 3 things:
-
Prometheus + cAdvisor
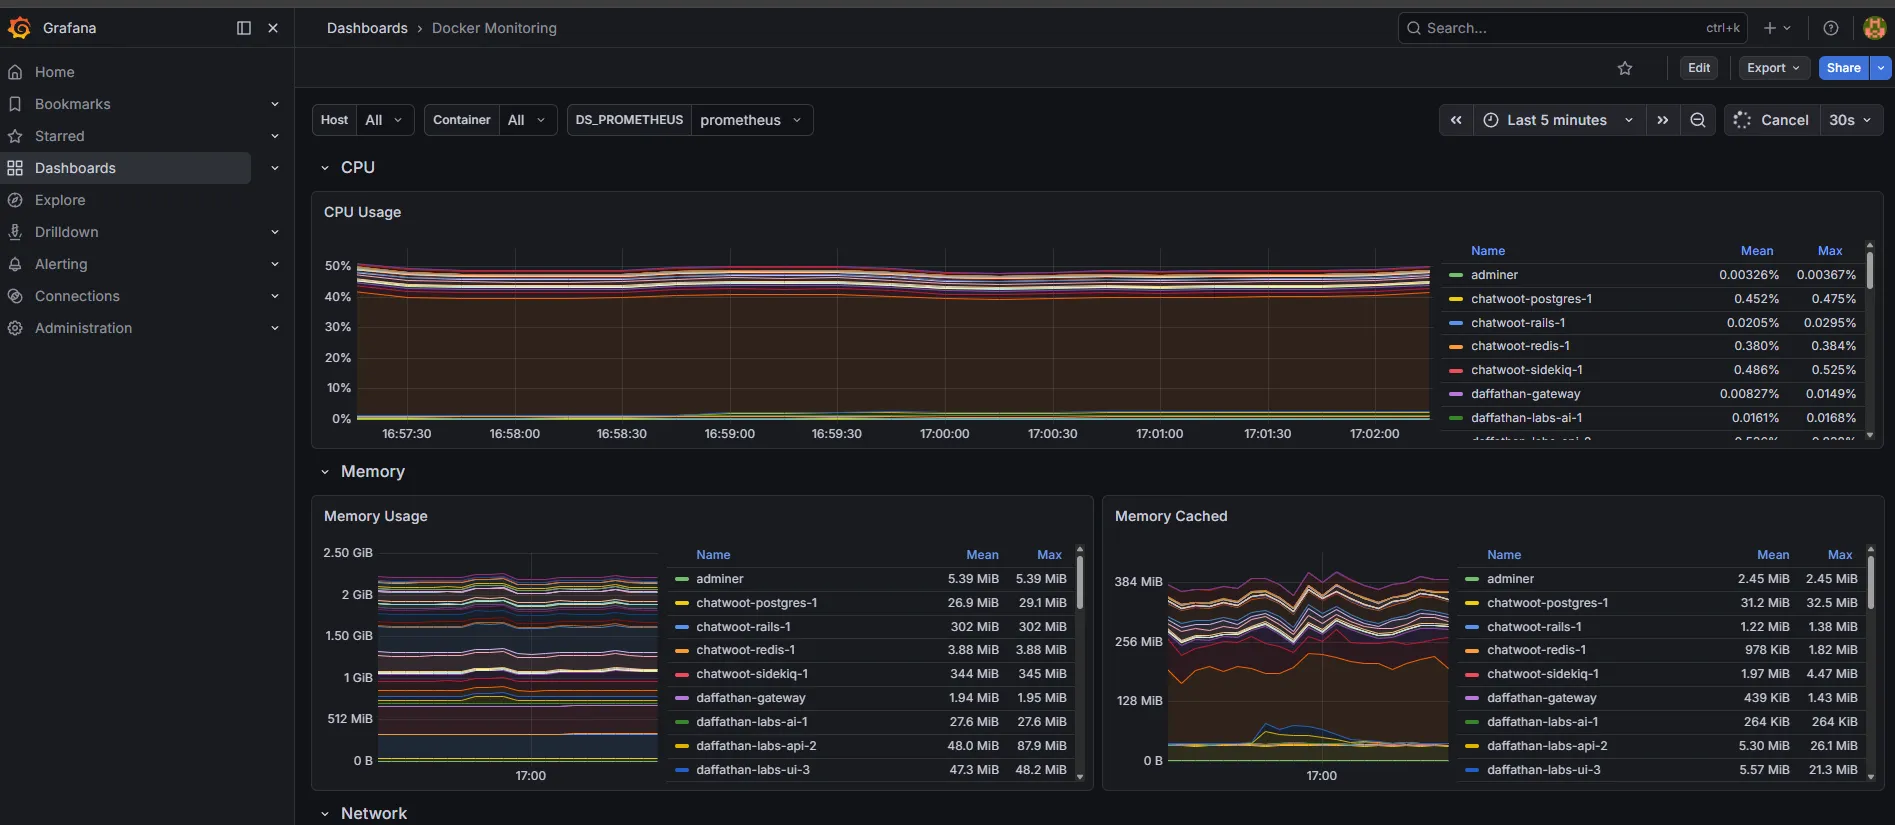 To see:
 -
CPU
-
RAM
-
Network
-
Resource usage
👉 This became the system's "heartbeat."
-
-
Loki + Promtail
To collect all logs from all containers.👉 This became the system's "voice."
-
Grafana
One place to see everything.👉 This became the system's "eyes."
💥 Problems That Almost Made Me Give Up
Honestly, it wasn't smooth.
I encountered several problems that made me think:
😵 Loki Error "empty ring"
Logs weren't coming in at all.
Promtail was running…
But Loki had no response.
Turns out the config was wrong.
😤 Promtail Couldn't Read Logs
Initially, no logs were coming in.
Turns out the problem was simple but annoying:
👉 permission & volume
volumes:

  - /var/lib/docker/containers:/var/lib/docker/containers:ro

  - /var/run/docker.sock:/var/run/docker.sock:ro
🤯 Could See Logs… But Couldn't Filter
This was the most confusing.
Logs were there.
But when filtered per container → empty.
Turns out the problem was with the labels.
The solution:
docker_sd_configs:

  - host: unix:///var/run/docker.sock
😑 "No Data" Even Though Data Exists
I thought the whole setup failed.
But… it was just the wrong place to look.
👉 Logs are in Loki, not Prometheus.
🚀 After Everything Was Set Up…
This is the change I felt:
🔍 I Can See Everything
All containers.
All logs.
All metrics.
In one dashboard.
⚡ Debugging Became Super Fast
Now I just use:
{container="daffathan-labs-api"}
And boom — errors appear immediately.
🧠 Database No Longer Mysterious
Now I can see:
-
Activity
-
Connection
-
Performance
👉 PostgreSQL is no longer a black box.
🧠 The Big Lesson
From all this, I learned one important thing:
System without observability = blind
-
Logs are the system's voice
-
Metrics are the system's condition
And most importantly:
If you can't see your system, you don't really control it.
🏁 Conclusion
Daffathan-Labs has changed now.
Not just a system that's "running"…
But a system that can be:
-
Seen
-
Understood
-
Controlled
Deployment is automated.
Security is default.
And now…
This system finally has eyes. 👁️🔥